The 2011-12 rail passenger usage figures can now be found on the Office of Rail Regulation website at http://www.rail-reg.gov.uk/server/show/nav.1529. As ever, they present a gloriously positive image and offer much opportunity for data mining.
The figures are officially merely estimates based on ticket sales. Ticketless travel is not included; if you want to appear in the figures then you are expected to acquire a point-to-point ticket. Last year’s figures were subsequently dismantled in the trade press, who pulled up lots of examples of stations with figures which were too low – so any doubtful figure here should probably be read upwards.
The Office of Rail Regulation concentrates on London Waterloo retaining its crown as the UK’s busiest station with some 94,045,510 entries and exits. So let’s headline with overall usage:
- 2008-09: 2,147,507,862 entries and exits overall.
- 2009-10: 2,130,772,509 entries and exits overall.
- 2010-11: 2,313,513,546 entries and exits overall.
- 2011-12: 2,468,852,506 entries and exits overall.
- This year the entries and exits figures have been persuaded to balance on 1,234,426,253 each.
- This is comfortably more than a sixth of the world’s total population.
- It represents an increase of 6.7% on last year.
- It is the fifth highest figure in the world, behind China, Germany, India and Japan. (This is not too far out from the list of the world’s largest economies, which currently tends to put the UK behind France, Germany, Japan, China and the USA.)
- It also represents an increase of 15.8% on 2009-10 and 14.9% on 2008-9, since when the country has been in recession, prices have been soaring, travel has been collapsing, etc.
- This is equivalent to one additional passenger for every seven who were travelling in 2008-9.
- Logically, therefore, every seven coach train on the network should have been increased to eight coaches in the last 4 years.
So let’s dive into the specifics. Because “entries and exits” is a bit of a mouthful, “users” will be used as a synonym:
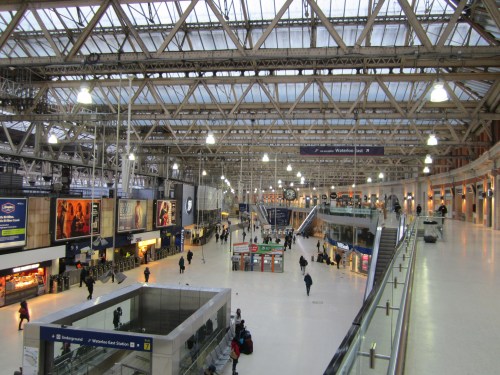
– Waterloo is of course top dog on 94,045,510 users.
 Waterloo’s rather large concourse, courtesy of the London and South Western Railway. Seen on a quiet Saturday morning.
– London Victoria is next, nearly 18 million entries and exits behind, on 76,231,190 users.
– The top ten is then rounded out by London Liverpool Street (3rd on 57,106,502), London Bridge (4th on 52,634,024), London Charing Cross (5th on 38,004,790), London Euston (6th on 36,608,546), London Paddington (7th on 33,736,546), Birmingham New Street (8th on 31,213,842), London King’s Cross (9th on 27,874,732) and Glasgow Central (10th on 26,639,418).
– 11th, for anyone who cares, is Leeds on 25,020,032.
– The busiest largely unelectrified station is Glasgow Queen Street, Scotland’s third busiest station (behind Glasgow Central and Edinburgh Waverley) on 20,929,594 users.
– The busiest totally unelectrified station (excluding Underground platforms) is coincidentally the quietest of the traditional London terminals – Marylebone, on 14,410,072 users.
– Wales’s busiest station is Cardiff Central on 11,502,080 users. This is coincidentally the busiest station to be unelectrified if one wishes to include London Underground facilities.
 Cardiff Central, packed with trains, at 06:00 on a Saturday morning.
– Birkenhead Central had the lowest number of passengers of any million-plus station (1,005,204 – scraping in having missed the target by 4,424 passengers last year)
– Nuneaton just missed the million with 999,516. It leads the 2,044 stations with fewer than 1 million passengers per annum.
– Falkirk High Level and Waterloo Merseyside were the only stations to fall through the 1 million ceiling last year, dropping from 1,008,182 to 991,826 and 1,014,942 to 954,782 respectively.
– There are 2,533 stations on the British rail network – a net increase of 2 over last year. Points will be awarded for locating them. (Britain’s newest station is Conon Bridge, at time of writing – points are also awarded for being able to point it out on a map – but since it only opened in February 2013 it’s not included in figures up to the end of March 2012.)
– The average number of station users is therefore 974,675.3. The nearest station to this is Hackney Wick, with 972,920 users – 2,680 per day (on a 363 day railway year)
– Because there’s an odd number of stations, the median station is inconveniently located at station No. 1266.5. Honours will therefore go equally to Davenport (216,182) and Boston (216,440) – 596 passengers per day.
– The 100,000 passenger mark is bordered by two wonderfully-named stations -Small Heath came just over on 100,126 passengers (with an admirable increase of around 15,000) while Rowlands Castle lost fewer than 600 passengers to lead the 875 stations which didn’t make this grade. It now rests on 99,884 users – a still admirable 275 per day.
– At the bottom of the 10,000 league we find Penhelig on 10,054 users, while leading the 248 stations which didn’t get that high is Little Kimble on 9,858 (or 27 per day). We are now heading down into the landscape of stations like St Budeaux Victoria Road (3,890), Netherfield (3,705), Yetminster (3,702), Clapham (not the big one, the one in Yorkshire with 3,695) and Brora (2,581).
– At the bottom of the 1,000 Club are St Keyne (properly St Keyne Wishing Well Halt and attracting 1,062 users) and Llangynllo (1,048 users). Leading the next 56 stations is Whitley Bridge, with 980 users, followed by Attadale on 970.
– Altnabreac, which has the honour of carrying the station code “ABC”, is the quietest of the notorious quartet of stations with no public road access (the others being rather more accessible, at Berney Arms in Norfolk, Dovey Junction on the Cambrian Coast and Corrour in the middle of Rannoch Moor). It claimed 238 entries and exits. The next station up the Far North line, Scotscalder, does have road access but only managed 214 entries and exits. Thus we prove that having a road connection has no obvious correlation to passenger levels.
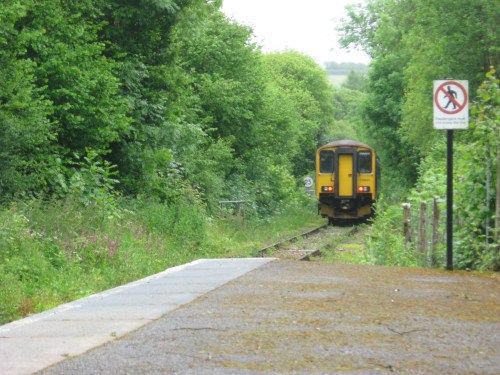
 Morning peak at Altnabreac, one of the farthest north stations in Britain.
– Buckenham came squarely on 100 and only 8 stations failed to make this level:
- Breich came in on 90;
- Barry Links, nowhere near the other trio of Barry stations in South Wales, also came nowhere near their usage levels and reached 86;
- Elton and Orston managed 72.
- Coombe, which two years ago came bottom of the table on 42, last year dropped further to 38 and was only saved from the utter bottom because two stations did worse. This year it managed 60 and is the best performing of the bottom 5. (This figure should however be adjusted to 58, since 6 of those passengers were this author and he failed to use two of his three return tickets.)
- Reddish South, with one train per week from Stockport to Stalybridge (there is no return service), reached 56. Nonetheless, the station has a “Friends” group.
- Denton, the other intermediate lightly-served station on the Stockport to Stalybridge run, managed 30. The offending train, should anyone wish to travel on it and drum up passenger numbers, currently runs Fridays only (retimed to 25 hours earlier than its previous schedule a while back). It leaves Stockport at 10:13, calls at Reddish South (10:20), Denton (10:24), Guide Bridge (10:30) and Stalybridge (10:36) and then wanders off to do something else. The single fare from end to end is £3.20, though to make it seem worthwhile it is preferable to join at an intermediate station. Emphasis is placed on the fact that once the train leaves Reddish South and Denton the next train at those stations will be a week later in the same direction (same time). Curiously, Denton station still has two platforms.
- Dorking West still benefits from a dodgy bit of calculating which generated an outcry last year when it kicked up a figure of 22 – which is estimated to actually be an accurate calculation of the number of people who use each evening peak train at the station (which has an hourly service). This year the computer, dissatisfied with its work last year, has hopefully suggested a total annual usage of 16.
- This is still some 14% higher than was achieved by Tees-Side Airport, which for the second year running is Britain’s least popular station. Last year’s 18 passengers was a hard one to beat, but this determined station has nonetheless gone lower and scored 14 annual users – or slightly better than one every 4 weeks.
– Interchanges is a bit cruel because only 538 stations are deemed to qualify. Dalston Junction is no longer actually a junction because the other spur from the junction goes to a station called Dalston Kingsland, but it nonetheless came bottom of the interchanges list with another station called Rose Grove and one interchanging passenger each.
– West Ealing managed 970 (on and off the Greenford branch) while Tring got 1,008 interchanges (presumably from terminating stopping trains onto fast services and vice versa).
– Interchange figures are still relevant since some stations can have relatively few passengers but still require facilities because lots of people change trains there. In fact interchange passengers, who can be hanging round for an hour or more, will expect more than passengers at some very busy stations who turn up aiming to board a train in the next two minutes. Most stations do nonetheless obtain much bigger usage figures than interchange figures, though one notable exception is Dovey Junction (1,296 entries and exits, down from 1,482 the previous year, against 1,216 interchanges between Cambrian Coast and Aberystwyth lines).
– St Erth, being a station which serves a small village and acts as junction for St Ives, also clocks relatively similar entrance/exit and interchange figures (179,632 interchanges against 202,362 entrances and exits). The station has also managed to increase its usage levels by 81,592 since last year.
– Over a million interchanges is an honour achieved by few stations (44 to be precise). Blackfriars crops in on 1,059,003; Guildford missed out on 989,765.
– All stations with over a million interchanges also have over a million passengers.
– London Waterloo inevitably has the second-highest number of interchanges with 9,488,822.
– Both Britain’s busiest station passenger-wise and Britain’s busiest station by train numbers and interchanges are former London and South-Western Railway affairs, suggesting that on sheer staying power this massively disorganised concern actually deserves some kind of award for Best Pre-Grouping Railway Company. It does, however, have to share with the London, Brighton and South Coast the glory of the runaway highest number of interchanges – at Clapham Junction (not the Yorkshire one, the South London one), with 21,609,997 people changing trains there annually on top of the 21,918,116 people who use the station to enter or exit the rail network. (And that was before the East London Line opened!)
On a more personal note:
Cornwall still has 36 stations, with Truro being the busiest on 1,278,354 and Coombe being the quietest on 60. Excluding Coombe, on the basis that it never wanted to be a real station, all Cornish stations generated over 1,000 passengers. St Keyne, St Columb Road, Menheniot and Calstock, three of which have dubious service levels, posted slight falls in passenger numbers (from St Keyne dropping 10 to Calstock dropping closer to 750).
 St Keyne station is in a tranquil wooded valley a mile from its village and with no car parking. This may explain its passenger figures. The service is very nearly hourly, with periodic gaps for “express” runs from Liskeard to Looe and back.
Otherwise all Cornish stations posted increases. The move from counting St Ives Ranger tickets as Rangers to allocating them stations means that the St Ives branch stations have posted stupid increases probably reflecting what’s really been happening for years rather than a sudden burst of popularity for Lelant Saltings:
- St Erth has risen from 120,770 to 202,362;
- Lelant Saltings has risen from 17,224 to 101,284;
- Lelant, the original station (Saltings is a park-and-ride pick up point which now has houses round it), rose from 1,842 to 2,910 (it has a very poor service relative to the others);
- Carbis Bay has moved from 55,334 to 206,736;
- St Ives has scraped to being just 1,436 passengers short of being Cornwall’s second most popular station (Penzance has just clung onto that honour without making it necessary to take interchanges into account) by rising from 258,530 to 578,214.
Excluding Perranwell, the Falmouth branch stations now all have over 100,000 passengers per annum (each). Penryn is comfortably the busiest, buoyed by the school and student population, with 211,220. Falmouth’s passengers are split across three stations, of which Falmouth Town is the busiest on 193,802. Penmere, the commuter station, totters in third on 171,604 – busy proving something about the Red Queen’s Race by beating Falmouth Town’s figure for the previous year without actually improving its place in the table. Falmouth Docks burbles along at the bottom of the key stations with 104,468; Perranwell, the request stop, brings up a dignified rear with 27,030 annual users (still a respectable increase on the 2010-11 figure of 21,454).
Most Cornwall stations (23 out of the 36) managed to generate enough additional custom to warrant a comment about it – mostly about continuing demand growth and timetable improvements.
The Severn Estuary line stations – Caldicot, Chepstow and Lydney – have managed their usual round of steady improvements. In May 2011 Chepstow and Lydney got their timetable improved. No records have been broken; the improvements have filled the edges of gaps rather than dramatically revitalising a rather inadequate service to three stations each on the outskirts of their respective townships. The results are, to be honest, a trifle disappointing, being largely within the national average:
- Caldicot, which hasn’t really seen a service improvement, is stable on 85,426 (up slightly from 83,292);
- Chepstow went from 188,374 to 203,496;
- Lydney rose from 149,860 to 156,648.
Corby is cheerily improving – up from 176,706 to 215,388 – while nearby Kettering is bouncing up to 995,526 with 75,281 interchanges (presumably between Corby and northward mainline services). Between them they are now nicely up to 1,210,914 – rather more than the 1,112,390 annual users that Kettering could attract before Corby opened.
 Kettering station on a Sunday lunchtime, with a Corby train at platform 2.
Passing idly through the data, the eye alights on the Highland commuter station of Muir of Ord, on that small network north of Inverness and known as “MOO” to its abbreviating friends. Traffic has risen sharply from 62,428 to 74,462. This is an increase of about 15%. The official comment alongside is “Cause of large increase not clear”.
The extremities are largely down, but are still healthy and overall post an increase:
- North is Thurso (faintly down by 68 from 48,172 to 48,104)
- East is Lowestoft (down from 418,866 to 413,534)
- South is Penzance (up from 556,546 to 579,648)
- West is Arisaig (faintly down by 108 from 7,622 to 7,530)
Finally, the two part-time stations in Devon:
- Sampford Courtenay rose from 76 to 136, nearly doubling its usage and thereby getting a flag for dramatically increasing traffic, which boringly points out that absolute entries and exits are very low;
- Okehampton fell by almost the same absolute amount, from 3,622 to 3,526.
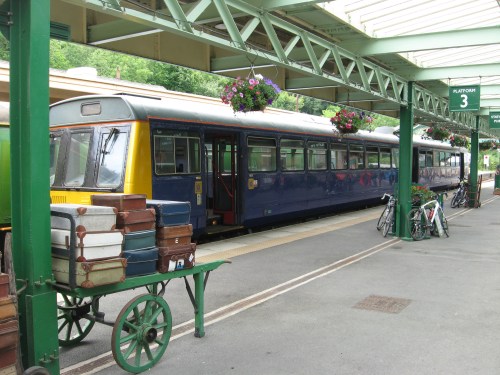
 Okehampton in summer 2011 with a typical train to Exeter at platform 3.
Considering that the line to Sampford and Okehampton is basically a disused railway, the traffic figures are acceptable (in total there were 36 fewer passengers than the previous year). It is worth noting that since these two stations operate on summer Sundays only they are highly dependent on advertising quality and quantity, how convenient a train every two hours actually is to leisure users and whether or not it rains all summer. 2011 was fairly unexceptional on the weather front. A thought which may explain the slight drops for three of the four extremities – all four are quite dependent on tourist levels.
So, that’s this year settled. Back next year – while the 2012-13 count has now closed, please do consider these figures when deciding which stations to lend your support to in 2013-14.
(And the two new stations were Southend Airport and Buckshaw Parkway, by the by. Smitham was also renamed Coulsdon Town for anyone who struggles to find it.)